
Analytics & Reporting
Turn Data Into Decisions You Can Trust
Analytics and reporting turns data into decisions people trust. Blue Mantis aligns the KPIs and metrics that matter, builds the semantic model that business intelligence tools sit on, delivers the dashboards and reports themselves, and extends into predictive and advanced analytics where the data supports it.
-
Align KPI definitions so reporting reflects business truth -
Deliver dashboards with drill-down detail for confidence and action -
Modernize BI platforms and semantic models for reuse and performance -
Enable adoption with validation sessions and user training
What Blue Mantis Delivers in Analytics and Reporting
Blue Mantis helps organizations turn data into trusted, actionable insight, from KPI alignment and semantic model design to dashboard modernization, predictive analytics, and lasting user adoption.
KPI & Metric Alignment
Blue Mantis defines and documents KPIs with stakeholders so everyone measures performance the same way, reducing rework and speeding delivery of trusted insights.
What Blue Mantis covers
- Stakeholder workshops to define KPI logic: Aligns business and technical teams on how performance should be measured.
- Measures and definitions documentation: Creates a shared reference for formulas, sources, calculation rules, and intended use.
- Acceptance criteria for trusted numbers: Establishes what reporting must meet before it is ready for business use.
- Semantic model requirements capture: Documents the relationships, business logic, and data requirements needed for consistent reporting.
- Prioritized reporting backlog: Identifies the highest-value dashboards, metrics, and reporting improvements to deliver next.
Covers
KPIsDefinitionsAlignmentGovernance
Semantic Model & Data Layer for BI
Blue Mantis builds semantic layers that support consistent KPIs, reusable reporting, and faster performance, creating a scalable foundation for trusted business intelligence.
What Blue Mantis covers
- Unified semantic model design: Creates a shared business layer that standardizes how data is organized, related, and used across reports.
- Measures and KPIs implemented and documented: Builds governed calculations that keep reporting logic consistent across dashboards and teams.
- Model performance optimization: Improves data model structure and calculation efficiency to support faster, more reliable reporting.
- Security and row-level access approach: Defines access controls that provide the right users with the right level of data visibility.
- Traceability back to source: Establishes clear connections between reported metrics, model logic, and underlying source data.
Covers
Semantic ModelMeasuresPerformanceSecurity
Dashboards & Reporting Delivery
Blue Mantis delivers dashboards and reports that preserve the views users rely on today, then improves them with clearer insights, better usability, and modern analytics capabilities.
What Blue Mantis covers
- Recreation of key reports for continuity: Rebuilds one to two critical reports so teams can maintain familiar reporting during modernization.
- Drill-down and detail pages: Gives users a clear path from high-level performance indicators to the underlying details.
- Cross-filtering and audit-friendly views: Helps teams explore related data, validate results, and understand what is driving performance.
- Executive and operational reporting: Delivers the right level of insight for leadership decisions and day-to-day business management.
- Embedded analytics patterns: Extends reporting into the applications and workflows where users need insights most.
Covers
DashboardsReportsDrill-DownAdoption
Predictive & Advanced Analytics
Blue Mantis extends reporting with predictive and advanced analytics that bring forward-looking insight into business workflows, without requiring a full ML platform build for every scenario.
What Blue Mantis covers
- Predictive models for defined outcomes: Applies focused models to forecast business conditions, identify likely outcomes, and support more proactive decisions.
- Scenario and trend analysis: Helps teams explore what is changing, what may happen next, and which factors are influencing performance.
- Embedded analytics in workflows: Brings predictive insight into the applications and processes where users make decisions every day.
- Model output validation: Tests whether insights are accurate, understandable, and useful before they are relied on in business workflows.
- Monitoring for stable use cases: Establishes a practical approach to tracking model performance, drift, and ongoing business relevance.
Covers
Predictive AnalyticsTrend AnalysisEmbedded AnalyticsValidation
What happens at each step
How Data & Analytics Modernization Works
Step 1
Align KPIs to Decisions
Blue Mantis confirms the decisions reporting should support, defines what good looks like, and documents KPI logic with subject matter experts.
Step 2
Build the Semantic Layer
Blue Mantis implements shared measures and definitions, then optimizes the model for reporting performance and reuse.
Step 3
Deliver High-Value Reports First
Blue Mantis recreates key reports for continuity, then adds drill-down capabilities and supporting detail pages.
Step 4
Validate and Train Users
Blue Mantis runs validation sessions to confirm accuracy and trains users to build confidence and reduce dependency.
Step 5
Scale Across Teams and Use Cases
Blue Mantis expands the reporting portfolio with reusable KPIs and models, introducing predictive and embedded analytics where they add value.
Why Blue Mantis?
One Program. One Owner. End to End.
KPI-first Delivery
We align on shared definitions before building, so reporting reflects agreed business truth, reduces rework, and supports confident decisions.
User Enabled Built In
Training and validation sessions build user confidence, support adoption, and reduce long-term dependency on the project team.
Fast Time-to-value
Deliver priority reports early and refine them over time, so value appears quickly, improves with feedback, and builds momentum.
Designed to Scale
Governance guardrails for oversight, monitoring, and standards are built in from the start to support responsible, scalable adoption.
Frequently Asked Questions
What is a semantic data layer and why does BI need one?
A semantic data layer is a shared business layer that standardizes how data is organized, related, and used across reports. BI needs one because it creates a consistent metric layer, so multiple reports use the same definitions. This reduces conflicting numbers, improves performance, and speeds delivery of new reporting requests. Blue Mantis documents the measures behind it and keeps traceability back to source data.
How do you decide which KPIs to report on?
Blue Mantis defines KPIs with stakeholders in workshops that confirm the decisions reporting should support. Business and technical teams agree on KPI logic, then formulas, sources, calculation rules, and intended use are documented as a shared reference. Acceptance criteria set what reporting must meet before business use, and a prioritized backlog identifies the dashboards and metrics to deliver next.
What is the difference between reporting and predictive analytics?
Reporting shows what has happened and what is happening now, through dashboards, drill-down pages, and executive and operational views. Predictive analytics looks forward, applying focused models to forecast business conditions and identify likely outcomes. Blue Mantis validates model output for accuracy and usefulness before it is relied on, then embeds that insight into the applications where people make decisions.
Can Blue Mantis migrate us from a legacy BI platform?
Yes. Blue Mantis can recreate priority reports in a new platform, mirroring legacy formats for familiarity while improving the model and governance behind the scenes. One to two critical reports are rebuilt first so teams keep familiar reporting during modernization. Validation sessions then confirm the numbers before the new reports are relied on.
How does Blue Mantis drive adoption?
Blue Mantis prioritizes continuity by recreating the reports users rely on, running validation sessions to prove accuracy, and providing training so users trust the new experience. Drill-down and detail pages give users a path from high-level indicators to the numbers behind them. Reporting is delivered at the right level for leadership decisions and day-to-day management.
Unlock the Full Potential of Your Data
Our team at Blue Mantis transforms dense data into decision-making you can trust, ensuring you have confidence when taking your next step towards growth.

Related Resources
Datasheet
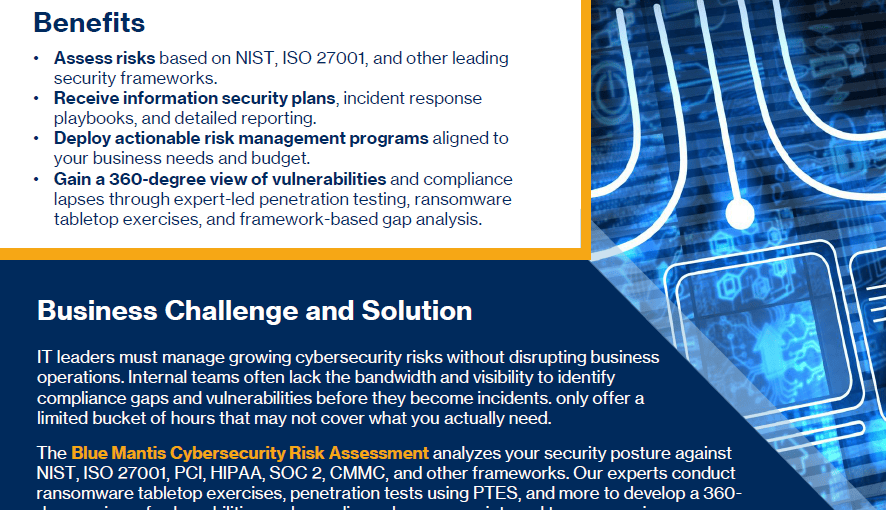
Assess analytics maturity, data quality, architecture, and AI readiness to expose gaps, avoid missteps, and establish a clear path forward.
Case Study
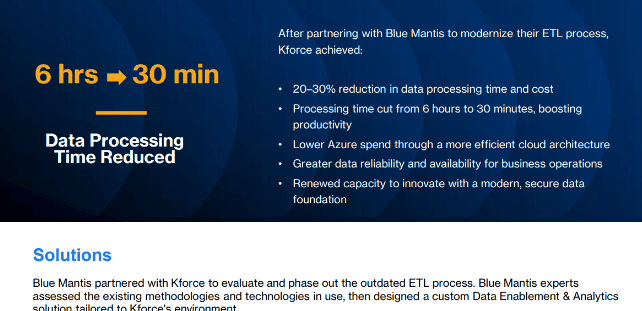
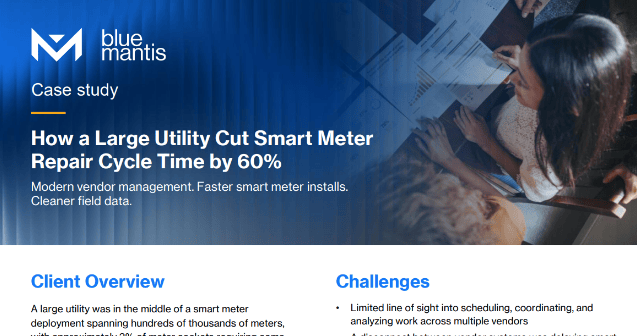
Disconnected vendor systems and manual coordination slowed smart meter repairs, driving up cycle time, cost, and rework.